PostgreSQL Scalability: Towards Millions TPS
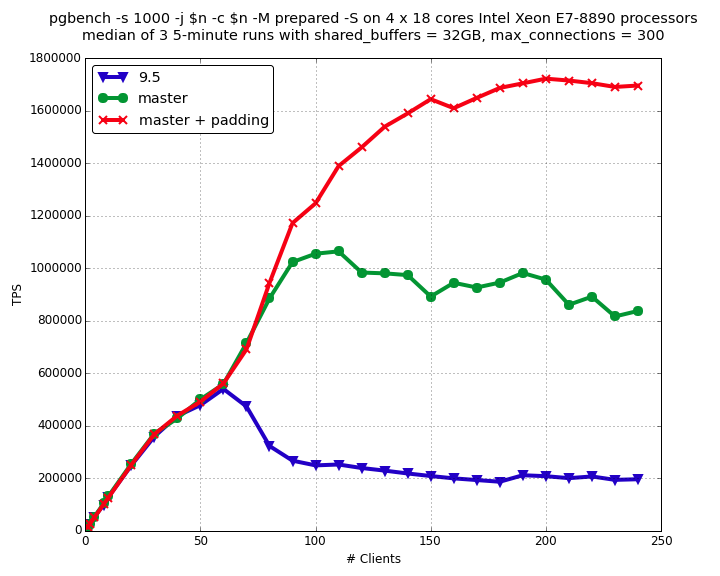
PostgreSQL scalability on multicore and multisocket machines became a subject of optimization long time ago once such machines became widely used. This blog post shows brief history of vertical scalability improvements between versions 8.0 and 8.4. PostgreSQL 9.2 had very noticeable scalability improvement. Thanks to fast path locking and other optimizations it becomes possible to achieve more than 350 000 TPS in select-only pgbench test. The latest stable release PostgreSQL 9.5 also contain significant scalability advancements including LWLock improvement which allows achieving about 400 000 TPS in select-only pgbench test.
Postgres Professional company also became involved into scalability optimization. In partnership with IBM we researched PostgreSQL scalability on modern Power8 servers. The results of this research was published in popular Russian blog habrahabr (Google translated version). As brief result of this research we identify two ways to improve PostgreSQL scalability on Power8:
- Implement Pin/UnpinBuffer() using CAS operations instead of buffer header spinlock;
- Optimize LWLockAttemptLock() in assembly to make fewer loops for changing lwlock state.
The optimization #1 appears to give huge benefit on big Intel servers as well, while optimization #2 is Power-specific. After long rounds of optimization, cleaning and testing #1 was finally committed by Andres Freund.
Extensible Access Methods Are Committed to 9.6
PostgreSQL 9.6 receives suitable support of extensible index access methods. And that’s good news because Postgres was initially designed to support it.
“It is imperative that a user be able to construct new access methods to provide efficient access to instances of nontraditional base types”
Michael Stonebraker, Jeff Anton, Michael Hirohama. Extendability in POSTGRES , IEEE Data Eng. Bull. 10 (2) pp.16-23, 1987
That was a huge work which consists of multiple steps.
Monitoring Wait Events in PostgreSQL 9.6
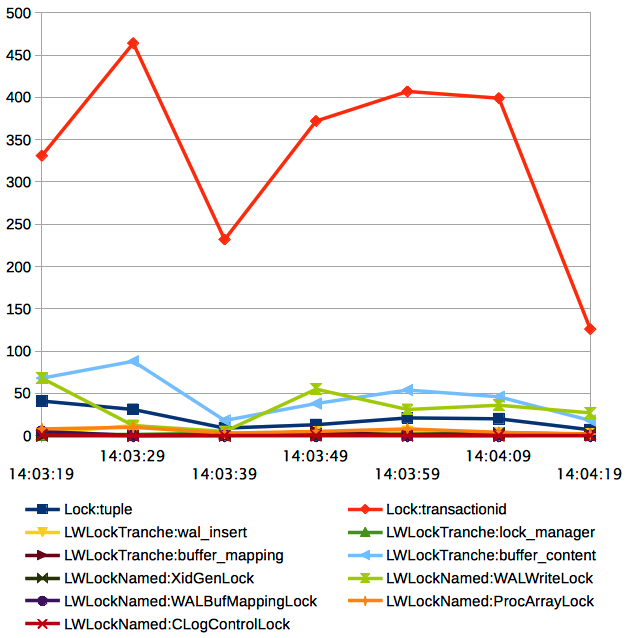
Recently Robert Haas has committed a patch which allows seeing some more detailed information about current wait event of the process. In particular, user will be able to see if process is waiting for heavyweight lock, lightweight lock (either individual or tranche) or buffer pin. The full list of wait events is available in the documentation. Hopefully, it will be more wait events in further releases.
It’s nice to see current wait event of the process, but just one snapshot is not very descriptive and definitely not enough to do any conclusion. But we can use sampling for collecting suitable statistics. This is why I’d like to present pg_wait_sampling which automates gathering sampling statistics of wait events. pg_wait_sampling enables you to gather statistics for graphs like the one below.
Pg_pathman UPDATE and DELETE Support and Benchmark
Recently pg_pathman receives support of UPDATE and DELETE queries. Because of some specialties of PostgreSQL query planner hooks, UPDATE and DELETE planning is accelerated only when only one partition is touched by query. Other way, regular slow inheritance query planning is used. However, case when UPDATE and DELETE touches only one partition seems to be most common and most needing optimization.
Also, I’d like to share some benchmark. This benchmark consists of operations on journal table with about 1 M records for year partitioned by day. For sure, this is kind of toy example, because nobody will split so small amount of data into so many partitions. But it is still good to see partitioning overhead. Performance of following operations was compared:
- Select single row by its timestamp,
- Select data for whole day (whole one partition),
- Insert one row with random timestamp,
- Update one row with random timestamp.
The following partitioning methods were compared:
- Single table, no partitioning,
- pg_partman extension,
- pg_pathman extension.
Benchmarks were done on 2 x Intel Xeon CPU X5675 @ 3.07GHz, 24 GB of memory server with fsync = off in 10 threads. See the results below.
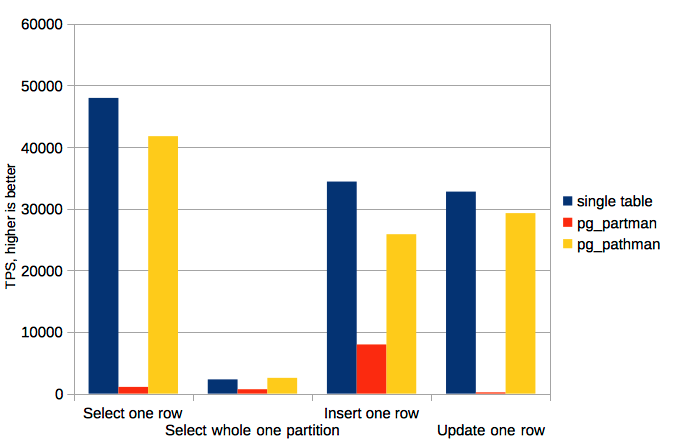
| Test name | single table, TPS | pg_partman, TPS | pg_pathman, TPS |
|---|---|---|---|
| Select one row | 47973 | 1084 | 41775 |
| Select whole one partition | 2302 | 704 | 2556 |
| Insert one row | 34401 | 7969 | 25859 |
| Update one row | 32769 | 202 | 29289 |
How Does Pg_pathman Handle Filter Conditions?
![]()
In my previous post I’ve introduced pg_pathman as an extension which accelerate query planning over partitioned tables. In this post I would like to covert another aspect of pg_pathman: it not only produce plans faster, but also produce better plans. Thanks to it query execution with pg_pathman becomes much faster in some cases.
When you search partitioned table with some filter conditions, pg_pathman adopts this filter to each individual partition. Therefore, each partition receives the only filter conditions which are useful to check against it.
Let me illustrate this on the example. At first, let’s see what’s happening with filter conditions while dealing with PostgreSQL inheritance mechanism.
Pg_pathman Beta Release
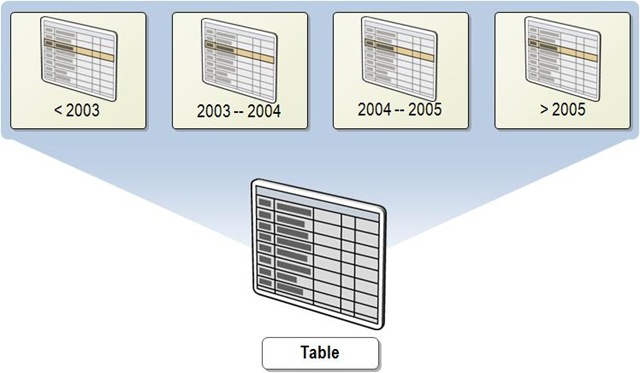
Partitioning in PostgreSQL is traditionally implemented using table inheritance. Table inheritance allow planner to include into plan only those child tables (partitions) which are compatible with query. Simultaneously a lot of work on partitions management remains on users: create inherited tables, writing trigger which selects appropriate partition for row inserting etc. In order to automate this work pg_partman extension was written. Also, there is upcoming work on declarative partitioning by Amit Langote for PostgreSQL core.
In Postgres Professional we notice performance problem of inheritance based partitioning. The problem is that planner selects children tables compatible with query by linear scan. Thus, for query which selects just one row from one partition it would be much slower to plan than to execute. This fact discourages many users and this is why we’re working on new PostgreSQL extension: pg_pathman.
pg_pathman caches partitions meta-information and uses set_rel_pathlist hook in order to replace mechanism of child tables selection by its own mechanism. Thanks to this binary search algorithm over sorted array is used for range partitioning and hash table lookup for hash partitioning. Therefore, time spent to partition selection appears to be negligible in comparison with forming of result plan nodes. See postgrespro blog post for performance benchmarks.
pg_pathman now in beta-release status and we encourage all interested users to try it and give us a feedback. pg_pathman is compatible with PostgreSQL 9.5 and distributed under PostgreSQL license. In the future we’re planning to enhance functionality of pg_pathman by following features.
- Execute time selection of partitions using custom nodes (useful for nested loops and prepared statements);
- Optimization of ordering output from partitioned tables (useful for merge join and order by);
- Optimization of hash join when both tables are partitioned by join key;
- LIST-partitioning;
- HASH-partitioning by attributes of any hashable type.
Despite we have pg_pathman useful here and now, we want this functionality to eventually become part of PostgreSQL core. This is why we are going to join work on declarative partitioning by Amit Langote which have excellent DDL infrastructure and fulfill it with effective internal algorithms.
Thoughts About Jsonb Statistics
Introduction
Users of jsonb datatype frequently complaint that it lucks of statistics.
Naturally, today jsonb statistics is just default scalar statistics, which is
suitable for <, <=, =, >=, > operators selectivity estimation. But
people search jsonb documents using @> operator, expressions with ->
operator, jsquery etc. This is why selectivity estimation, which people
typically get in their queries, is just a stub. This could lead wrong query plans
and bad performance. And it made us introduce hints in jsquery extension.
Thus, problem is clear. But the right solution is still unclear, at least for me. Let me discuss evident approaches to jsonb statistics and their limitations.
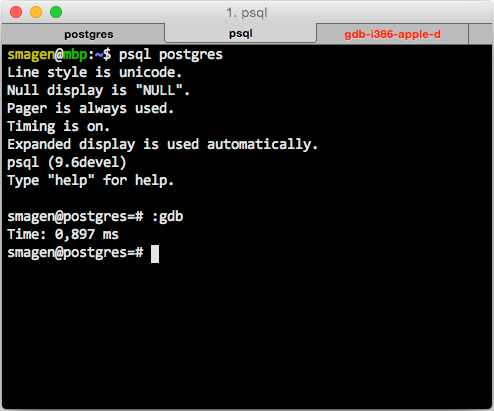
Psql Command to Attach Gdb to Backend
While hacking PostgreSQL it’s very useful to know pid of the backend you are
working with. You need to know pid of the process to attach debugger, profiler
etc. Luckily, .psqlrc provides us an elegant way to define the shortcuts for
psql. Using config line below one can find out backend pid just by typing :pid.
1
| |
1 2 3 4 5 | |
In 9.6 it becomes possible to even include backend pid into psql prompt.
However, it’s possible to automate more complex actions in psql. I’ve configured
my psql to run gdb attached to current backend in new tab of iTerm2 just by
typing :gdb.