Monitoring Wait Events in PostgreSQL 9.6
Recently Robert Haas has committed a patch which allows seeing some more detailed information about current wait event of the process. In particular, user will be able to see if process is waiting for heavyweight lock, lightweight lock (either individual or tranche) or buffer pin. The full list of wait events is available in the documentation. Hopefully, it will be more wait events in further releases.
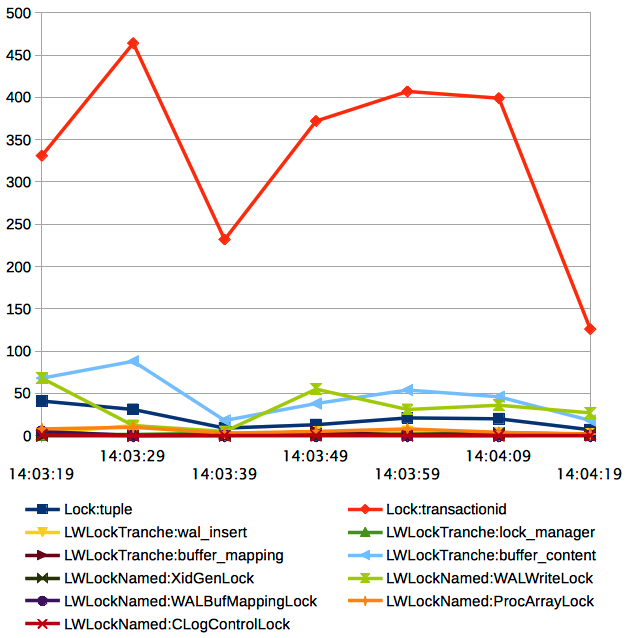
It’s nice to see current wait event of the process, but just one snapshot is not very descriptive and definitely not enough to do any conclusion. But we can use sampling for collecting suitable statistics. This is why I’d like to present pg_wait_sampling which automates gathering sampling statistics of wait events. pg_wait_sampling enables you to gather statistics for graphs like the one below.

Let me explain you how did I draw this graph. pg_wait_sampling samples wait events into two destinations: history and profile. History is an in-memory ring buffer and profile is an in-memory hash table with accumulated statistics. We’re going to use the second one to see insensitivity of wait events over time periods.
At first, let’s create table for accumulated statistics. I’m doing these experiments on my laptop, and for the simplicity this table will live in the instance under monitoring. But note, that such table could live on the another server. I’d even say it’s preferable to place such data to another server.
1 2 3 4 5 | |
Secondly, I wrote a function to copy data from pg_wait_sampling_profile view to profile_log table and clean profile data. This function returns number of rows inserted into profile_log table. Also, this function discards pid number and groups data by wait event. And this is not necessary needed to be so.
1 2 3 4 5 6 7 8 9 10 11 12 13 14 15 | |
And then I run psql session where setup watch of this function. Monitoring of our system is started. For real usage it’s better to schedule this command using cron or something.
1 2 3 4 5 6 7 8 9 10 11 12 13 | |
We can see that write_profile_log returns 0. That means we didn’t insert anything to profile_log. And this is right because system is not under load now. Let us create some load using pgbench.
1 2 | |
In the parallel session we can see that write_profile_log starts to insert some data to profile_log table.
1 2 3 4 5 | |
Finally, let’s examine the profile_log table.
1 2 3 4 5 6 7 8 9 10 11 12 13 | |
How to interpret these data? In the first row we can see that count for tuple lock for 14:03:19 is 41. The pg_wait_sampling collector samples wait event every 10 ms while write_profile_log function writes snapshot of profile every 10 s. Thus, it was 1000 samples during this period. Taking into account that it was 10 backends serving pgbench, we can read the first row as “from 14:03:09 to 14:03:19 backends spend about 0.41% of time in waiting for tuple lock”.
That’s it. This blog post shows how you can setup a wait event monitoring of your database using pg_wait_sampling extension with PostgreSQL 9.6. This example was given just for introduction and it is simplified in many ways. But experienced DBAs would easily adopt it for their setups.
P.S. Every monitoring has some overhead. Overhead of wait monitoring was subject of hot debates in mailing lists. This is why features like exposing wait events parameters and measuring each wait event individually are not yet in 9.6. But sampling also has overhead. I hope pg_wait_sampling would be a start point to show on comparison that other approaches are not that bad, and finally we would have something way more advanced for 9.7.