Drawing Graphs Directly in Psql
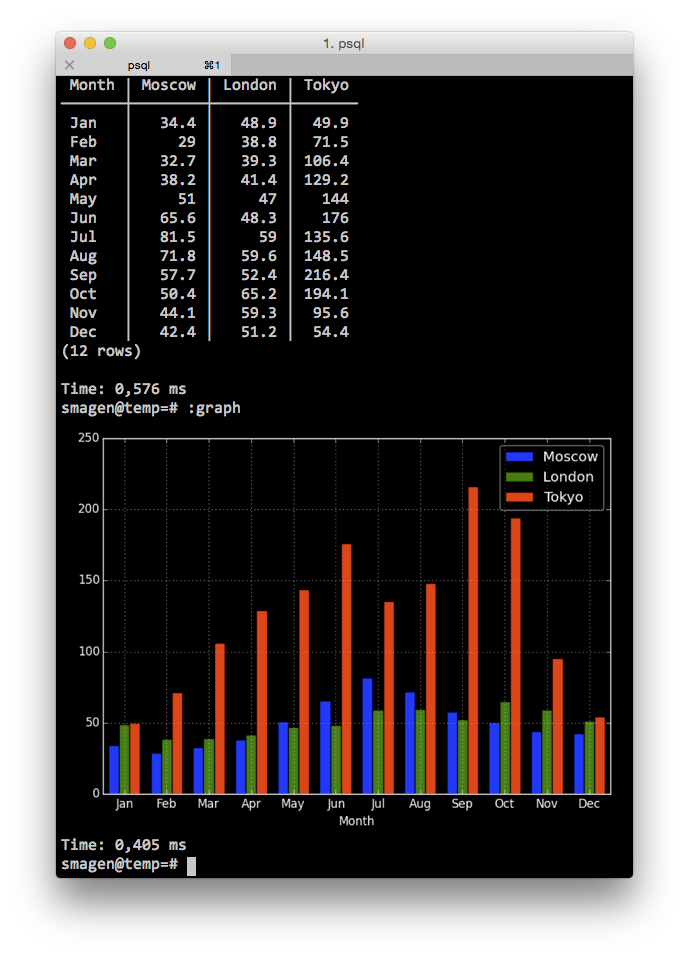
For people who are actively working with psql, it frequently happens that you want to draw graph for the table you’re currently seeing. Typically, it means a cycle of actions including: exporting data, importing it into graph drawing tool and drawing graph itself. It appears that this process could be automated: graph could be drawn by typing a single command directly in psql. See an example on the screenshot below.
It might seem like a magic, but actually there is absolutely no magic. iTerm2 supports image inlining since version 3 which is currently beta. Thus, if we put image surrounded with corresponding escape sequences it will appear in the terminal. From psql side we need to redirect output to the script which would do it. We can define a macro for simplifying this like in one of my previous posts.
1
| |
And finally we need a pg_graph script which parses psql output, draws graph and puts it into stdout. I wrote one using Python and matplotlib. It recognizes first column as series of X-values and rest of columns as series of Y-values. If first column contains only decimal values it draws a plot chart, otherwise it draws a bar chart.
Thereby, it’s not hard to teach psql to do more things. Also, we can consider some improvements to psql including:
- Add output format option for
\gwhich would make it easier to parse psql output from scripts; - Provide elegant way to pass parameters into psql macro.